Trace and debug the Linux kernel functions
by @Jonathan Salwan - 2013-05-26Introduction
Who never wanted to trace and debug its kernel to understand some features or other... It was my case. A few days ago, I needed to know what was the functions which were called and what was these arguments. To do this we have lots of possibilities. We can patch the kernel to display some debug information when the kernel function is called but this technique is impractical - why ? Because when you git pull or download the new kernel version, you need to re-apply all your debug information. The best, is to develop a kernel module and use the Linux API. So, I searched what can the kernel API offers me.
Kprobes
Kprobes is a dynamic instrumentation system implemented since the Linux 2.6 and it was implemented to help kernel developers to debug their features. With kprobes it is possible to set several handlers on a specific function :
- Handler called before addr is executed.
- Handler called after addr is executed.
- Handler called if executing addr causes a fault.
- Handler called if breakpoint trap occurs in probe handler.
To enable kprobes in your kernel you need to compile it.
> cat /usr/src/linux-3.x.git/.config | grep KPROBES
CONFIG_KPROBES=y
CONFIG_HAVE_KPROBES=y
CONFIG_HAVE_KPROBES_ON_FTRACE=y
# CONFIG_KPROBES_SANITY_TEST is not set
>
Kprobes provides simple data structures which allows the developers to insert or remove the handlers.
int register_kprobe(struct kprobe *p);
void unregister_kprobe(struct kprobe *p);

struct kprobe {
        [...]
        kprobe_opcode_t *addr;
        const char *symbol_name;
        kprobe_pre_handler_t pre_handler;
        kprobe_post_handler_t post_handler;
        kprobe_fault_handler_t fault_handler;
        kprobe_break_handler_t break_handler;
        [...]
};
The addr attribute takes a linear address but it is also possible to set an exported symbol with the symbol_name attribute. Then, all handlers take a function pointer with the kprobe and the pt_reags struct.
typedef int  (*kprobe_pre_handler_t)   (struct kprobe *, struct pt_regs *);
typedef int  (*kprobe_break_handler_t) (struct kprobe *, struct pt_regs *);
typedef void (*kprobe_post_handler_t)  (struct kprobe *, struct pt_regs *,
                                        unsigned long flags);
typedef int  (*kprobe_fault_handler_t) (struct kprobe *, struct pt_regs *, int trapnr);
How kprobes works
All these functions are cool and work very well, but how are they working ? As kprobe is a dynamic instrumentation system, it patchs/plays with the kernel opcodes at runtime. It saves en replaces the first opcodes by the break point opcode - 0xcc. In the kprobes.h we can find the DEFINE as you can see below - Intel x86.
#define BREAKPOINT_INSTRUCTION  0xcc
#define RELATIVEJUMP_OPCODE     0xe9
#define RELATIVEJUMP_SIZE       5
#define RELATIVECALL_OPCODE     0xe8
#define RELATIVE_ADDR_SIZE      4
And it copies the older opcode in a structure called arch_specific_insn.
struct arch_specific_insn {
        /* copy of the original instruction */
        kprobe_opcode_t *insn;
        /*
         * boostable = -1: This instruction type is not boostable.
         * boostable = 0: This instruction type is boostable.
         * boostable = 1: This instruction has been boosted: we have
         * added a relative jump after the instruction copy in insn,
         * so no single-step and fixup are needed (unless there's
         * a post_handler or break_handler).
         */
        int boostable;
        bool if_modifier;
};
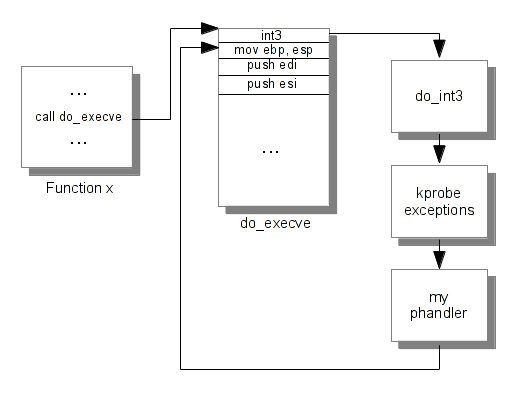
When the function is triggered, the int3 occurs and the interruption handler is taken. To test it, I have created a module which use kprobe on the do_execve kernel function. I check its assembly code before and after the call to register_kprobe and in my pre-handler I dump and display the call stack when do_execve is called.
[ 4569.527250] Before register_kprobe at do_execve (0xc1101120)
[ 4679.899047] 55 89 e5 57 56 53 83 ec 18 89 45 e4 64 a1 ec a5
[ 4679.899059] 93 c1 f6 40 0d 10 89 55 e0 8b 90 cc 02 00 00 89
[ 4679.899069] 4d dc 74 2c 8b 52 5c bb f5 ff ff ff 8b 80 7c 03
[ 4679.899078] 00 00 8b 52 04 8b 80 cc 01 00 00 39 c2 76 11 83

[ 4679.899769] After register_kprobe at do_execve (0xc1101120)
[ 4679.899772] cc 89 e5 57 56 53 83 ec 18 89 45 e4 64 a1 ec a5
[ 4679.899782] 93 c1 f6 40 0d 10 89 55 e0 8b 90 cc 02 00 00 89
[ 4679.899792] 4d dc 74 2c 8b 52 5c bb f5 ff ff ff 8b 80 7c 03
[ 4679.899801] 00 00 8b 52 04 8b 80 cc 01 00 00 39 c2 76 11 83

[ 4681.428392] Function trigged at do_execve (0xc1101120)
[ 4681.428399] cc 89 e5 57 56 53 83 ec 18 89 45 e4 64 a1 ec a5
[ 4681.428409] 93 c1 f6 40 0d 10 89 55 e0 8b 90 cc 02 00 00 89
[ 4681.428419] 4d dc 74 2c 8b 52 5c bb f5 ff ff ff 8b 80 7c 03
[ 4681.428428] 00 00 8b 52 04 8b 80 cc 01 00 00 39 c2 76 11 83
[ 4681.428452] Call Trace:
[ 4681.428465]  [<d0892067>] my_phandler+0x57/0x70 [trace]
[ 4681.428478]  [<c166ad5b>] aggr_pre_handler+0x3b/0x80
[ 4681.428484]  [<c1669cff>] kprobe_exceptions_notify+0x3df/0x460
[ 4681.428492]  [<c1101120>] ? free_bprm+0x40/0x40
[ 4681.428496]  [<c166ab25>] notifier_call_chain+0x45/0x60
[ 4681.428501]  [<c166ab8d>] atomic_notifier_call_chain+0x1d/0x20
[ 4681.428504]  [<c166abbd>] notify_die+0x2d/0x30
[ 4681.428508]  [<c16684c0>] do_int3+0x30/0x90
[ 4681.428512]  [<c1668239>] int3+0x29/0x30
[ 4681.428517]  [<c110007b>] ? setup_arg_pages+0x26b/0x2d0
[ 4681.428522]  [<c1101121>] ? do_execve+0x1/0x3a0
[ 4681.428532]  [<c1009d62>] ? sys_execve+0x32/0x70
[ 4681.428537]  [<c166e082>] ptregs_execve+0x12/0x18
[ 4681.428542]  [<c166dfcc>] ? sysenter_do_call+0x12/0x22

[ 4681.430726] After unregister_kprobe at do_execve (0xc1101120)
[ 4681.430730] 55 89 e5 57 56 53 83 ec 18 89 45 e4 64 a1 ec a5
[ 4681.430739] 93 c1 f6 40 0d 10 89 55 e0 8b 90 cc 02 00 00 89
[ 4681.430749] 4d dc 74 2c 8b 52 5c bb f5 ff ff ff 8b 80 7c 03
[ 4681.430758] 00 00 8b 52 04 8b 80 cc 01 00 00 39 c2 76 11 83
As you can see, the first opcode of the do_execve function is replaced and when do_execve is trigged an interruption occurs and kprobe_exceptions_notify takes over and executes our pre-handler. Here is a diagram explaining that.
Jprobes
Jprobe is an abstraction of kprobe. This feature is mainly used to get the arguments passed to the targeted function. As we can see in the previous subsection kprobe uses the int3 instruction to jump in our debug function. But with this feature, it is difficult to get the arguments passed on our target function. As you can see below, the jprobe structure contains just an 'entry point' pointer and the kprobe structure.
int register_jprobe(struct jprobe *p);
void unregister_jprobe(struct jprobe *p);

struct jprobe {
        struct kprobe kp;
        void *entry;        /* probe handling code to jump to */
};
Jprobes works exactly as kprobes excepted when the interruption occurs the registers structure and the stack pointer is saved and restored before that our function is called. As you can see below, the call trace between int3 and our function my_phandler is transparent.
[  629.906401] Call Trace:
[  629.906413]  [<d085d02c>] my_phandler+0x2c/0x40 [trace]
[  629.906422]  [<c1009d62>] sys_execve+0x32/0x70
[  629.906432]  [<c166e082>] ptregs_execve+0x12/0x18
[  629.906437]  [<c166dfcc>] ? sysenter_do_call+0x12/0x22
Examples
In the Linux directory we can find good samples, which uses jprobes and kprobes feature. For easier use, I use the procfs to target the kernel function. Just send the name of the function in the proc node.
# insmod ./trace.ko
# cat /proc/trace
Function traced : none
# printf '__kmalloc' > /proc/trace
# cat /proc/trace
Function traced : __kmalloc
# dmesg
...
[ 1880.977375] ]=------------------------
[ 1880.977378] Function  : __kmalloc
[ 1880.977378]
[ 1880.977380] args 0: 000000e0  args 1: 000000d0  args 2: cb0463c0
[ 1880.977382] args 3: 00000003  args 4: 00001812  args 5: 00000000
[ 1880.977382]
[ 1880.977386] Pid: 6974, comm: dmesg Tainted: G           O 3.5.7-gentoo #3
[ 1880.977387] Call Trace:
[ 1880.977391]  [<d08b9074>] trace+0x74/0xa0 [trace]
[ 1880.977396]  [<c113cbca>] load_elf_binary+0x83a/0x11c0
[ 1880.977400]  [<c123627f>] ? _copy_from_user+0x3f/0x60
[ 1880.977404]  [<c113c390>] ? elf_map+0xc0/0xc0
[ 1880.977408]  [<c10ffa07>] search_binary_handler+0xc7/0x2c0
[ 1880.977413]  [<c1101410>] do_execve+0x2f0/0x3a0
[ 1880.977418]  [<c1009d62>] sys_execve+0x32/0x70
[ 1880.977423]  [<c166e082>] ptregs_execve+0x12/0x18
[ 1880.977427]  [<c166dfcc>] ? sysenter_do_call+0x12/0x22
[ 1880.977429] ]= EOF -------------------
# printf 'none' > /proc/trace
You can find the previous module in my github.